
OpenGL 1.5: Errors
Unhandled Exception!
Chapter.Errors.Intro: Intro was not found.
Handling errors with C# is a very standard affair armed with try and catch. Unfortunately (again) for us these stalwarts are not quite up to the task of dealing with the beast that is OpenGL. In this brief detour we’ll look over some of the tactics we have available to handle those errors and some other tips and tricks.
Completing this chapter is optional and you can skip on to Chapter 2 and come back to this later.
Callbacks
void OnDebugMessage(
    DebugSource source,
    DebugType type,
    uint id,
    DebugSeverity severity,
    int length,
    nint pmessage,
    nint userParam)
{
    string message = Marshal.PtrToStringAnsi(pmessage, length);
    Console.WriteLine("[{0} source={1} type={2} id={3}] {4}", severity, source, type, id, message);
}

GLDebugProc DebugMessageDelegate = OnDebugMessage;
GL.DebugMessageCallback(DebugMessageDelegate, nint.Zero);
GL.Enable(EnableCap.DebugOutput);

GL.Enable(EnableCap.DebugOutputSynchronous);

// setup code
What the heck is this and what are we expected to do with it?! This is a Delegate and when dealing with C based APIs they’re the tool of choice for handling errors. Lets start by looking at OnDebugMesssage to see why it looks the way it does.
If you’re not familiar with C#’s Local Function feature it’s a little surprising at first. As the name suggests it allows a function to be declared within the local scope of another function. In our case we’re declaring a void function with a laundry list of arguments.
We can check out the wiki to find GLAPI/glDebugMesssageCallback which documents exactly what we’re up to. Armed with this we can look through the arguments and get to know them a little better. DebugSource source covers what part of OpenGL raised the message; DebugType type is the class of message - typically DebugTypeError; uint id is a unique identifier for each message - very helpful when you have thousands pouring in; DebugSeverity severity is the level of message from Notification to High to allow filtering. Finally we get to the less obvious ones: int length and nint pmessage are a pair and describe a C style string but thankfully C# can print these directly; then the mysteriousnint userParam which is a pointer to a method supplied when the callback was registered - almost always null in our applications.
Phew that was a lot to cover I don’t blame you for taking a breather before we cover the rest of this code.
First we need to create a delegate to wrap our local function to prevent it from being garbage collected. Next is the most important line where we register this delgate with OpenGL. Next to our delegate is the input side of the nint userParam pointer we can see in our callback. We’re passing nint.Zero to indicate no function is registered.
We’ll look at why GL.Enable exists and what it does later on - for now we’re going to use it to enable debug messages. Without enabling it our registered callback won’t get called!
Finally we also enable Synchronous debug output to force OpenGL to spit out errors as soon as they happen. This makes debugging a lot easier but comes with serious performance caveats. While learning and developing enabling this is a great idea but for production code you’ll want to consider your options.
Shaders Off
So far, hopefully, our shaders have compiled correctly first time but what happens if that’s not the case? Just like C# the GLSL compiler will happily point out all our flaws if we should only listen. Unlike the previous section this code doesn’t live in the main function but in our Shader class. Ask 10 programmers how to do this and you’ll get 12 options so here’s mine:
private void CompileShader(int shader)
{
    GL.CompileShader(shader);

    GL.GetShaderi(shader, ShaderParameterName.CompileStatus, out int code);
    if (code != (int)All.True)
    {
        GL.GetShaderInfoLog(shader, out var infoLog);
        throw new Exception($"Error compiling shader.{Environment.NewLine}{infoLog}");
    }
}
Add this method to the Shader class and replace GL.CompileShader with just CompileShader to hook it up. With the housekeeping done we can look at what’s been added. First up is the original call to GL.CompileShader which continues to do an excellent job of compiling the shader.
Things get interesting with GL.GetShaderi which is a format of call you’ll come to recognize. Whenever we ask for data back from OpenGL it will be done in this way. Here we’re asking for an integer hence the i suffix; can you figure out what float or vector3 look like? As the shader either compiled sucessfully or didn’t why isn’t this GetShaderb? Remember OpenGL is a C API and you might be surprised to find there’s no bool type! A value of 0 is false and convention is 1 is true which you can double check by looking at the value of All.True and All.False.
If the shader failed to compile and All.False was returned then we can do the same as before but this time with the aptly named GL.GetShaderInfoLog. If you check the documentation the signature looks a little different. Here OpenTK does a little work for us and transforms the C string output into a C# string out instead.
For our project we’ll throw an Exception containing the info log then let the program terminate.
Somebody Call A RenderDoc!
We’ve looked at errors that happen before you can draw something to screen but these don’t offer any solace when your code runs but the resulting graphics are all wrong. While a good first approach is to output the interested part to the fragment colour channel it can only go so far.
RenderDoc is an open source graphics debugger that lets you break down every call that goes into a frame. Head on over and download the right version for you then we’ll briefly cover how to set it up for a typical .net project.
Before we dive in make sure you can build your project without debugging. You’ll need to know the full bin directory of your project which typically ends with /LearnOpenTK/bin/Debug/net8.0/ depending on version and build type. Armed with this open up RenderDoc and take a moment to appreciate the functional design.
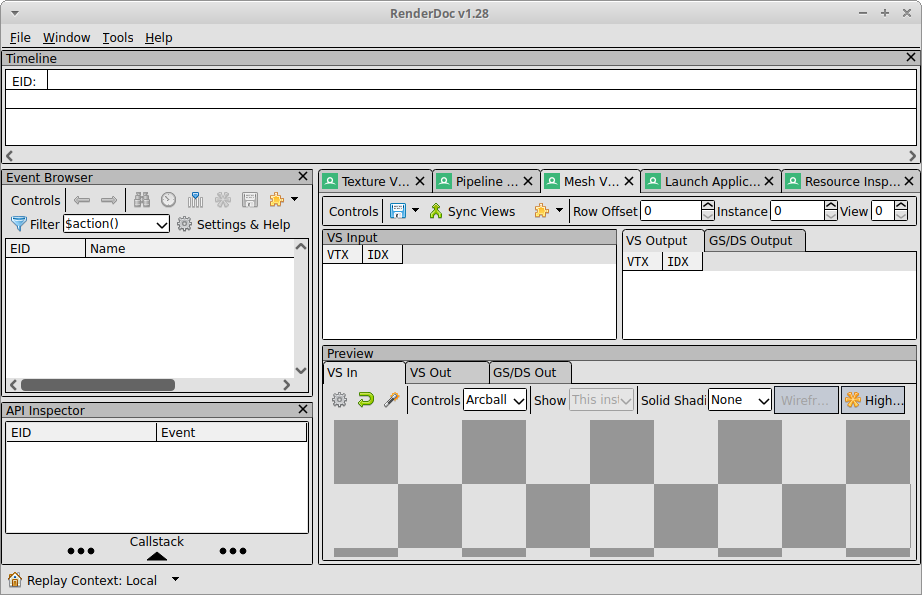
We need to launch our application through RenderDoc in order for it to do its magic. Start with the File menu and Launch Application or Ctrl+N which doesn’t open any dialogs but changes the main tab to the Launch Application tab. Inside this tab we’ll need to fill out the Executable Path and Working Directory fields before launching. The first, Executable Path, is the location of the LearnOpenTK.exe file which might just be LearnOpenTK depending on your OS. The second, Working Directory, should be the root folder of your project /code/LearnOpenTK and NOT the net8.0 folder or anywhere else.
If everything is set correctly you should be able to launch your application via the Launch button!
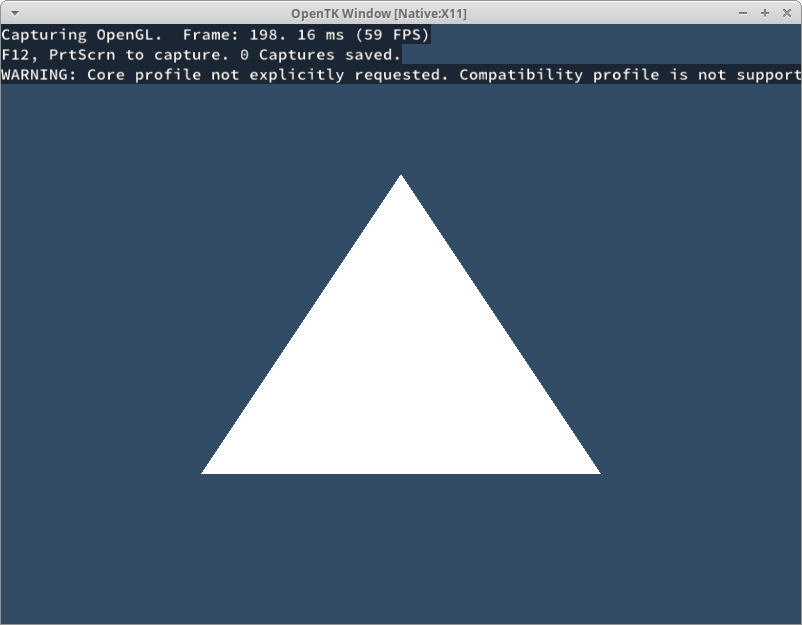
When attached RenderDoc will add debug text to the top left and let you know to hit F12 or PrintScreen to generate a capture. Doing so will pause for a moment as it grabs everything then let you continue. We’re just rendering the same triangle every frame so hit that capture button and close your window.
Once RenderDoc has loaded your capture it’ll swap over to the Texture Viewer tab and by default show your Backbuffer Color output. On the left the Event Browser lists what happened during the frame, we can see our glClear and glDrawArrays along with some extra info. Our current project is so barebones there’s not really anything else we can learn with RenderDoc. When used with complex programs with convoluted draw operations it really shines.
I’ll stop here as explaining RenderDoc completely first requires you to have a solid understanding of OpenGL and we’re still working on that, and secondly because it’d double the size of this entire series! There’s a lot of resources out there on how to get the most of it so check them out if you’re interested.
Continue with Chapter 2: Chapter Still Buffering
Originally published on 2025/04/23